このページは、nAGライブラリのJupyterノートブックExampleの日本語翻訳版です。オリジナルのノートブックはインタラクティブに操作することができます。
nAG最適化モデリングスイートを使用したキャリブレーション問題からの外れ値の除去
このノートブックの正しいレンダリング
このノートブックでは、方程式と参照のためにlatex_envs
Jupyter拡張機能を使用しています。ローカルにインストールしたJupyterでLaTeXが正しくレンダリングされない場合は、この拡張機能をインストールしていない可能性があります。詳細は
https://jupyter-contrib-nbextensions.readthedocs.io/en/latest/nbextensions/latex_envs/README.html
をご覧ください。
キャリブレーション問題
モデル\(f\)の5つのパラメータを与えられたデータ点に適合させる単純なキャリブレーション問題を考えます。モデルは以下の形式です: \[ \min_{x\in\mathbb{R}^5} \sum_{i=1}^{30}\left( f(t_i, x) - y_i \right)^2 \] ここで、\(x=[a,b,c,d,\omega]\)は適合させるパラメータで、\(f(t, x) = at^2 + bt+ c + d\sin(\omega t)\)がモデルです。
データ
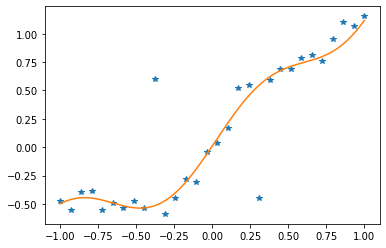
初期データ点\(\{(t_i, y_i)\}\)は以下を使用してシミュレートされました \[(a=0.3,b=1.0,c=0.01,d=0.2,\omega =5.0)\] ここで、\(t_i\)は\(\left[-1.0,1.0\right]\)に均一に分布し、\(y_i=f(t_i,x)+\epsilon_i\)で\(\epsilon_i\)はランダムノイズです。
これらの点のうち2つ(\(y_{10}\)と\(y_{20}\))は、外れ値の存在をエミュレートするために修正されました。
import pickle
import numpy as np
import matplotlib.pyplot as plt
import math

# シミュレーションデータを読み込み、2つの外れ値を含む
data = pickle.load(open('nlnlsq_data.pck', 'rb'))
nres = len(data['y'])

# データ点と、それらを生成するために使用された真の関数をプロットする
f_true = lambda t : 0.3*t**2 + t + 0.01 + 0.2*math.sin(5.0*t)
plt.plot(data['t'], data['y'], '*')
t = np.linspace(-1.0,1.0, num=200)
y = [f_true(x) for x in t]
plt.plot(t, y)
plt.show()
キャリブレーション問題のセットアップ
まず、ソルバーが任意のパラメータセット \(x\) でのフィットの品質を決定するために使用するコールバックを定義することから始めます。
def lsqfun(x, nres, inform, data):
    """
    Objective function callback passed to the least squares solver.
    """
    rx = np.zeros(nres)
    t = data['t']
    y = data['y']
    for i in range(nres):
        rx[i] = (
            x[0]*t[i]**2 + x[1]*t[i] + x[2] + x[3]*np.sin(x[4]*t[i]) - y[i]
            )
    return rx, inform
def lsqgrd(x, nres, rdx, inform, data):
"""
Computes the Jacobian of the least square residuals.
"""
n = len(x)
t = data['t']
for i in range(nres):
rdx[i*n+0] = t[i]**2
rdx[i*n+1] = t[i]
rdx[i*n+2] = 1.0
rdx[i*n+3] = np.sin(x[4]*t[i])
rdx[i*n+4] = x[3]*t[i]*np.cos(x[4]*t[i])
return informnAG ’ハンドル’を問題の次元といくつかのオプションパラメータで初期化します。
from naginterfaces.library import opt
from naginterfaces.base import utils

nvar = 5
# 変数の数で最適化モデルのハンドルを初期化する
handle = opt.handle_init(nvar)

# 密な非線形最小二乗目的関数を定義する
opt.handle_set_nlnls(handle, nres)

# ソルバーの出力を制御するためのオプションパラメータを設定する
for option in [
        'Print Options = NO',
        'Print Level = 1',
        'Print Solution = X',
        'Bxnl Iteration Limit = 100',
]:
    opt.handle_opt_set(handle, option)

# 省略された反復出力のために明示的なI/Oマネージャーを使用する:
iom = utils.FileObjManager(locus_in_output=False)
外れ値の問題を解決する
# ソルバーを呼び出す
x = np.ones(nvar, dtype=float)
res = opt.handle_solve_bxnl(handle, lsqfun, lsqgrd, x, nres, data=data,
                  io_manager=iom)
E04GG, Nonlinear least squares method for bound-constrained problems
Status: converged, an optimal solution was found
Value of the objective 1.05037E+00
Norm of gradient 8.78014E-06
Norm of scaled gradient 6.05781E-06
Norm of step 1.47886E-01
Primal variables:
idx Lower bound Value Upper bound
1 -inf 3.61301E-01 inf
2 -inf 9.10227E-01 inf
3 -inf 3.42138E-03 inf
4 -inf -6.08965E+00 inf
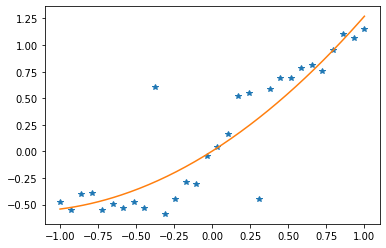
5 -inf 6.24881E-04 infフィッティングされたパラメータでモデルをプロットし、外れ値の影響を確認できます:
# データ点とフィッティングされた関数をプロットする
x = res.x
f_out = lambda t : x[0]*t**2 + x[1]*t + x[2] + x[3]*math.sin(x[4]*t)
plt.plot(data['t'], data['y'], '*')
y = [f_out(z) for z in t]
plt.plot(t, y)
plt.savefig("outlier_fit.png")
plt.show()
外れ値を除去して再度解く
# 2つの外れ値残差を無効にする
opt.handle_disable(handle, comp='NLS', idx=[10, 20])

# 問題をもう一度解いてください
x = np.ones(nvar, dtype=float)
res = opt.handle_solve_bxnl(handle, lsqfun, lsqgrd, x, nres, data=data,
                      io_manager=iom)
E04GG, Nonlinear least squares method for bound-constrained problems
Status: converged, an optimal solution was found
Value of the objective 5.96811E-02
Norm of gradient 1.19914E-06
Norm of scaled gradient 3.47087E-06
Norm of step 3.49256E-06
Primal variables:
idx Lower bound Value Upper bound
1 -inf 3.53888E-01 inf
2 -inf 1.06575E+00 inf
3 -inf 1.91383E-03 inf
4 -inf 2.17299E-01 inf
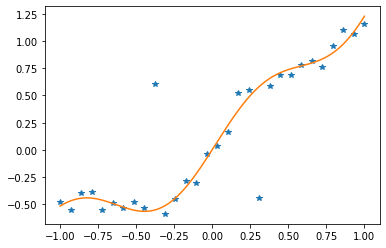
5 -inf 5.17660E+00 infフィッティングされた関数はデータにずっと近くなりました!
# データ点とフィッティングされた関数をプロットする
x = res.x
f_fit = lambda t : x[0]*t**2 + x[1]*t + x[2] + x[3]*math.sin(x[4]*t)
plt.plot(data['t'], data['y'], '*')
y = [f_fit(z) for z in t]
plt.plot(t, y)
plt.show()
opt.handle_free(handle)このノートブックで紹介されているソルバーは、最適化モデリングスイート(nAGライブラリに付属)を通じてアクセスできます。最適化モデリングスイートについてさらに詳しく知るか、フォームに記入してください。できるだけ早くご連絡いたします。
